Cost of Living City Ranking 2024


These three cities have kept the same positions in Mercer’s rankings that they had last year. At the other end of the spectrum, the cities that ranked the lowest for living costs are Islamabad, Lagos and Abuja.
A number of key factors have influenced the world’s economy in recent years. In 2024, these factors continue to have an impact on the cost of living in major cities:
- Inflation and exchange-rate fluctuations are directly affecting the pay and savings of internationally mobile employees (or those executing an international assignment).
- Heightened economic and geopolitical volatility, as well as local conflicts and emergencies, have led to additional expenses in areas such as housing, utilities, local taxes and education.
- In the case of the higher-ranking cities (Hong Kong, Singapore and Zurich), factors such as expensive housing markets, high transportation costs and higher cost of goods and services have all contributed to high living costs.
- Conversely, in Islamabad, Lagos and Abuja the demonstrably lower costs of living of international assignees have, in part, been driven by currency depreciations.
Mercer’s annual Cost of Living City Ranking provides valuable trends and insights for those who need to make informed decisions about global mobility operations and international assignees. The ranking lists 2261 cities in the world in order, from the most expensive to the least expensive places to live. The comprehensive ranking serves as a valuable compass, providing guidance through the intricate landscape of living expenses in cities worldwide.
Top 10 most and least expensive cities in the world 2024
Regional overview
Of the 10 most expensive cities for international assignees, half are located in Western Europe, with Switzerland being home to four. However, it is Southeast Asian cities that lead the list, with Hong Kong and Singapore remaining in the first and second positions, respectively. The two most affordable cities are Lagos (225) and Abuja (226), both located in Nigeria (on the African continent).
European cities feature heavily in the top 10 most expensive places to live. In addition to the four Swiss cities, London has joined the top 10 ranking in 8th place. Other expensive cities in the region include Copenhagen (11), Vienna (24), Paris (29) and Amsterdam (30).
Dubai has jumped up the rankings to become the costliest city in the Middle East for international employees. It is ranked 15th on the global ranking, up three places from 2023. The next most expensive city in this region is Tel Aviv, which has dropped by eight places to rank 16th. It is followed by Abu Dhabi (43), Riyadh (90) and Jeddah (97).
Within South America, Montevideo in Uruguay ranks as the most expensive location for international employees at number 42. It is followed by Buenos Aires (77, down 32 places) and Sao Paulo (124). It is worth noting that, in addition to Buenos Aires becoming a less expensive place to live, Santiago in Chile also fell 73 places to 160th on the list.
In North America, New York City (number 7 in the global ranking) remains the most expensive city. It is followed by Nassau, Bahamas (9), Los Angeles (10), Honolulu (12), and San Francisco (13). The biggest differences found in North America’s year-on-year rankings are both in Mexico. The capital, Mexico City, went up 46 places to 33, and Monterrey went up 40 places to 115.
African cities that placed highest in the global Cost of Living City Ranking are Bangui (14, up 12 places), Djibouti (18) and N'Djamena (21). The least expensive cities in the region include Blantyre (221), Lagos (225, down 178 places) and Abuja (226).
In addition to Hong Kong and Singapore, the other most expensive cities in Asia include Shanghai (23), Beijing (25) and Seoul (32). Some of the least expensive cities in the region are Karachi (222), Bishkek (223) and Islamabad (224).
Finally, for the Pacific region, Sydney tops the list at 58th place, followed by Noumea, New Caledonia (60); Melbourne (73); and Brisbane (89). New Zealand’s Auckland and Wellington remain the least expensive Pacific locations, coming in at 111th and 145th, respectively.
Ranking list
Price movements around the world
Eggs: The chart shows the movement in the price of eggs across different locations. The data refers to 12 large eggs. The biggest increase was seen by Buenos Aires, followed by Istanbul. Los Angeles, Paris, New York and Toronto all saw a price decrease.
Olive oil: The chart shows price movements of olive oil across selected locations. The data refers to olive oil (1lt / 33.8 oz / 920 gr). All locations had a price increase apart from Seoul which saw a decrease of 10.4%. The highest price increase occurred in Buenos Aires, followed by Istanbul, Berlin, Madrid and London.
Cup of coffee: The chart shows the movement of coffee prices across selected locations. The data refers to an espresso coffee at a popular café including any service charge across selected locations between March 2023 and March 2024. Buenos Aires saw the largest increase, followed by Istanbul. Rome, Tokyo, Seoul, Mumbai, Singapore, Nairobi, Beijing and Dakar all experienced price decreases.
Gasoline: The chart shows the movement of gasoline prices across selected locations. The data refers to 1lt of gasoline, unleaded 95 octane. By far, the highest price increase occurred in Buenos Aires, followed by Istanbul. The most significant price decrease occurred in Rome, followed by Dubai. Dakar and Mexico City experienced no change.
Blue jeans: The chart shows the price movement of a pair of jeans across selected locations. The data refers to a pair of Men’s blue jeans. Buenos Aires experienced the highest price increase, followed by Istanbul, Nairobi and Dakar. Johannesburg, Rome and Berlin saw a decrease in prices.
Haircut: The chart shows the price movements of a Woman’s haircut across selected locations. The data refers to a Woman’s haircut including shampoo, cut and styling. Buenos Aires experienced the largest increase followed by Istanbul. Beijing, Madrid, Dakar, New York, Dubai, Seoul, Tokyo and Johannesburg experienced a decrease in prices.
With continued inflationary pressures across the globe, it is important to take a closer look at how the cost of selected goods has evolved since last year. To do this, we analyzed the cost of a basket of everyday items:
- 12 large eggs
- 1 L of olive oil
- Espresso coffee at popular café
- 1 L of gasoline (unleaded 95 octane)
- Men’s blue jeans
- Women’s shampoo, haircut and styling
On average, the costs of all these products have increased, with the most notable increase being in the price of olive oil. Some cities have experienced higher price hikes for this commodity than others. For example, Buenos Aires saw a 694% increase, while Istanbul saw a 145% rise.
- 1 Housing
- 2 Inflation
The cost of housing is a major factor in the Cost of Living City Ranking. Between 2023 and 2024, there was a lot of volatility in this cost around the world, with housing rental prices varying significantly between cities. For example, the Turkish city of Istanbul saw an average price increase of 301%, while Tel Aviv saw a decrease of 22% and Minsk, Belarus, saw a decrease of 10%.
Rental price surges were also experienced by Ankara, another city in Türkiye, which saw an average increase of 141%. Dubai saw housing prices jump by 21%, New Delhi average rental costs increased by 13% and the same average increase was noted in Miami, Florida.
Most of the top 10 most expensive cities also saw increases, although these were more moderate, coming in at between 3% and 8% for all the cities except Nassau, Bahamas, which reported no change to the accommodation rental prices.
A contributing factor to the cost of housing is a shortage of housing relative to the number of people looking for housing. This mismatch between supply and demand is driving prices up for international assignment logistics. Such costs can be particularly challenging in areas with high population growth or with limited land available for development. Other factors, such as construction costs and land prices, can also affect housing affordability. As a result, for some international assignees, the cost of housing in their host country may be significantly higher than in their home country.
When housing costs are high, employees may need to spend a significant portion of their income on rent or mortgage payments, leaving them with less disposable income for other expenses. This can lead to financial stress and a reduced standard of living, which can have a negative impact on employee morale and well-being.
Rising housing costs in many cities around the world have made it increasingly challenging for organizations to attract and retain top talent for international assignments. As housing costs rise, organizations may need to allocate a larger portion of their budgets to provide competitive compensation packages that include housing allowances or subsidies. This, in turn, may put a strain on the financial resources of these organizations, especially if they have a large number of employees in high-cost areas.
Mercer’s inflation definition
Headline living changes
Top five cost-of-living ranking increases
Top five cost-of-living ranking decreases
Between 2023 and 2024, the most significant decreases in cost of living rankings were seen in cities in Africa (Lagos, Luanda and Abuja), South America (Santiago) and Eastern Asia (Osaka).
Currency devaluations have been a significant driver of these decreases. There have also been some reductions in the cost of high-end housing (e.g., in Santiago). The currency-induced falls in the cost of living for international assignees have happened even though inflation in many of these countries has risen. For example, between March 2023 and March 2024, the inflation rate increased to more than 20% for both Nigeria and Angola.
Cost versus quality of living: Beyond cost considerations
In today’s ever-evolving global landscape, the factors that make a location attractive extend far beyond mere cost considerations. While cost undoubtedly still plays a significant role, companies and employees are increasingly prioritizing other factors when evaluating the appeal of a destination. Quality of life, safety and security, and the presence of robust infrastructure and seamless connectivity have become key determinants of a location’s allure.
In the current global political climate, local and regional tensions are escalating and conflict zones are proliferating. This has meant that the safety and security of employees has become a priority for organizations worldwide. Other risks and negative issues have also come to the fore, ranging from natural disasters to inadequate infrastructure and limited international connectivity. All these can have a significant impact on the decision-making process of companies and their employees.
The chart below shows the correlation between the cost and quality of living across selected cities around the world. It also highlights how each location ranks with respect to safety, eco-friendliness and infrastructure.
Comparing the data on costs and quality of living highlights the challenge of finding the sweet spot between the two — in other words, a city that combines low costs with a high quality of life. According to Mercer’s recent data, just eight cities in the ranking have achieved this (Ljubljana, Montreal, Warsaw, Zagreb, Budapest, Panama City, Santiago and Kuala Lumpur).
This list of eight cities should be of interest to families looking for a better lifestyle, remote working/digital nomads and companies looking for locations that will be attractive to top talent.
It is an unavoidable fact that high-quality living comes with a large price tag. Locales that boast an abundance of amenities and services naturally command a premium. In addition, cities that offer a high quality of life become magnets, attracting a growing influx of individuals. This popularity sets in motion a chain reaction — first, housing costs rise, then a ripple effect occurs and the prices of restaurants, services, and other items go up. This is the price of prosperity.
A paradoxical phenomenon can sometimes be observed in urban centers that have a generally poor quality of life. The cost of living for international assignees stationed in such hardship locations can soar to unexpected heights. This is because such assignees are often cut off from the convenience and cheap prices of local goods and services (due to security fears, etc.). They therefore find themselves at the mercy of overpriced shops and housing options. This stark reality lays bare the income inequality prevalent in emerging markets.
The correlation between the cost of living and the quality of living in cities can be complex. It is therefore important to acknowledge that many factors, some fleeting in nature, may influence the overall picture. Additionally, in many locations, international issues (such as those linked to the strengths of different currencies) come into play.
What this means for businesses
The cost-of-living crisis has already had a significant impact on the mobile talent employed by multinational organizations. High living costs have required some assignees to adjust their lifestyles and cut back on discretionary spending. Some employees have even struggled to meet their basic needs.
For businesses, this has made it more difficult to attract and retain top talent. It has also increased the costs of compensation and benefits, limited talent mobility options, and raised general operational costs.
It is therefore important for organizations to stay informed about the cost-of-living trends and inflation rates in the different locations in which they operate. They should also work to understand how price changes are affecting their employees. If they do not, they may not be able to effectively manage the impact of these challenges on their global talent.
Organizations should explore innovative solutions to address these issues — to ensure the well-being and satisfaction of their employees. Options include offering competitive compensation packages, providing support services and exploring alternative talent-sourcing strategies.
As there are multiple issues to contend with, any solutions should be tailored to meet the specific needs of the businesses, places and people involved. One effective approach is to seek input from employees and to engage in open communication — this can help address concerns and find solutions that work for both an organization and its employees.
Methodology
This year’s ranking methodology encompassed 226 cities across five continents. It assessed the comparative costs of over 200 items in each location — from housing and transportation to food, clothing, household goods and entertainment. To ensure consistency in city-ranking comparisons, New York City was utilized as the base city and currency movements were measured against the US dollar.
The figures utilized in our cost comparisons stem from a survey conducted in March 2024, encompassing over 400 cities. Exchange rates from that time, coupled with data from Mercer’s international basket of goods and services (used in its Cost of Living Survey), were employed for calculations and baselines.
The comprehensive data Mercer collected — and the ranking this data generated — offer a vital tool for employers. These provide the essential information needed to design efficient and transparent compensation packages for international assignees. To delve deeper into this topic, you can find more information on our Mobility Exchange website.
Get to know our solutions
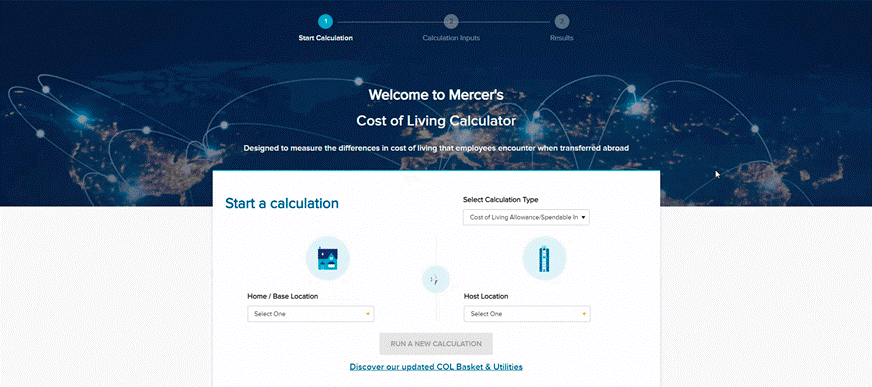
Mercer’s Cost of Living 2.0 Calculator
Sign up for your 14-day free trial: Empower your decision-making with our Cost of Living Calculator
Sign up today for our 14-day trial and experience the full potential of our Cost of Living 2.0 tool. We will be thrilled to have you on board and as you explore the tool's extensive range of features and benefits. During this trial, you can explore key functionality and witness firsthand how our solution streamlines your international assignee budget workflow, boosts efficiency, and drives tangible results.
Eligibility: The trial access is exclusively available to mobility professionals who are actively engaged in the field. By requesting trial access, you confirm that you meet this eligibility requirement.
Access details will be provided within two business days.